Introduction
Immigration has long played an important role in Manitoba’s growth and prosperity. Honouring that great tradition, we continue to promote our province as the destination of choice for skilled immigrants and immigrant entrepreneurs, and to welcome refugees and family sponsored newcomers from around the world.
Data in this report was created by the Province of Manitoba using IRCC Q2 2017 immigration data. Please note that all values between 0 and 5 are shown as “– –”. This is done to prevent individuals from being identified when IRCC data is compiled and compared to other publicly available statistics.
1. Immigration Trends
By July 1, 2016, Manitoba was estimated to have more than 1.32 million people representing about 3.6% of Canada’s total population. In 2016, 16,821 permanent residents (5.7% of total immigration to Canada) chose Manitoba as their immigration destination. Based on labour force survey data, of all landed immigrants in 2016, 20.7% made up Manitoba’s labour force with the second highest employment rate in Canada and second lowest unemployment rate across all jurisdictions.
In 2016, Canada welcomed 296,352 new permanent residents, an increase of 9.0% over 2015. By immigration category, the largest groups were skilled workers (22.1%), family class (26.3%) and Provincial Nominees (15.6%).
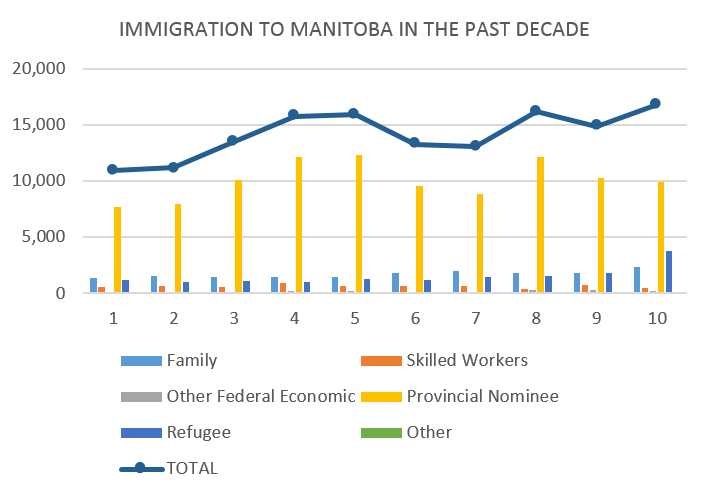
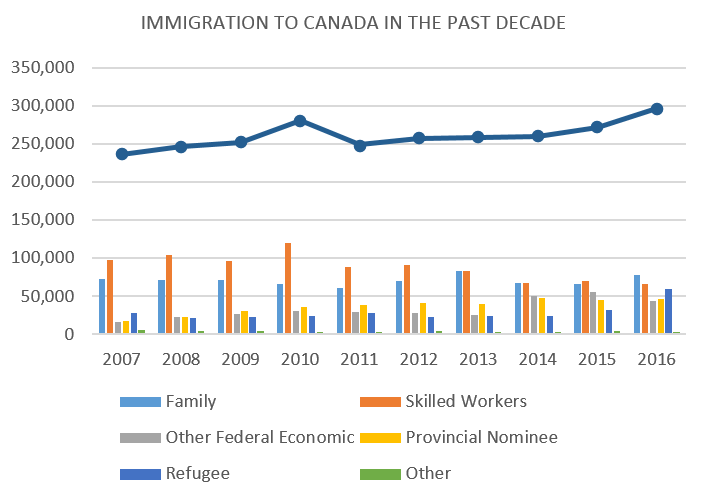
Table 1: Immigration to Manitoba in the Past Decade
| Category | 2007 | 2008 | 2009 | 2010 | 2011 | 2012 | 2013 | 2014 | 2015 | 2016 |
|---|---|---|---|---|---|---|---|---|---|---|
| Family | 1,406 | 1,500 | 1,470 | 1,450 | 1,485 | 1,788 | 1,993 | 1,844 | 1,847 | 2,379 |
| Federal Skilled Worker | 560 | 605 | 600 | 899 | 619 | 659 | 612 | 390 | 716 | 489 |
| Other Federal Economic | 82 | 123 | 154 | 200 | 191 | 143 | 130 | 273 | 273 | 242 |
| Provincial Nominee | 7,687 | 7,967 | 10,152 | 12,177 | 12,342 | 9,528 | 8,857 | 12,189 | 10,262 | 9,958 |
| Refugee | 1,170 | 972 | 1,098 | 1,032 | 1,303 | 1,143 | 1,464 | 1,505 | 1,768 | 3,730 |
| Other | 49 | 50 | 47 | 50 | 23 | 47 | 50 | 30 | 34 | 23 |
| Total | 10,954 | 11,217 | 13,521 | 15,808 | 15,963 | 13,308 | 13,106 | 16,231 | 14,900 | 16,821 |
Table 2: Immigration to Canada in the Past Decade
| Category | 2007 | 2008 | 2009 | 2010 | 2011 | 2012 | 2013 | 2014 | 2015 | 2016 |
|---|---|---|---|---|---|---|---|---|---|---|
| Family | 72,139 | 71,894 | 71,982 | 65,553 | 61,335 | 69,868 | 83,375 | 67,647 | 65,484 | 78,005 |
| Federal Skilled Worker | 97,870 | 103,763 | 95,972 | 119,377 | 88,769 | 91,417 | 83,229 | 67,600 | 70,136 | 65,607 |
| Other Federal Economic | 16,301 | 22,919 | 27,162 | 31,133 | 28,915 | 28,447 | 25,123 | 49,970 | 55,703 | 44,219 |
| Provincial Nominee1 | 17,093 | 22,416 | 30,380 | 36,428 | 38,415 | 40,880 | 39,899 | 47,628 | 44,535 | 46,178 |
| Refugee | 27,963 | 21,860 | 22,851 | 24,699 | 27,876 | 23,095 | 24,139 | 24,070 | 32,113 | 58,913 |
| Other2 | 5,385 | 4,390 | 3,823 | 3,498 | 3,391 | 4,054 | 3,266 | 3,377 | 3,844 | 3,430 |
| Total | 236,751 | 247,242 | 252,170 | 280,688 | 248,701 | 257,761 | 259,031 | 260,292 | 271,815 | 296,352 |
2. Immigration Levels
In 2016, immigration to Manitoba increased 23.8% from 2015. This increase was largely a result of 1,233 Syrian refugees that were resettled to Manitoba as part of the National Syrian Refugee Resettlement Initiative.
Table 3: Manitoba Permanent Residents by Immigration Category
| Immigration Category | 2014 | 2015 | 2016 | |||
|---|---|---|---|---|---|---|
| Sponsored Family | 1,844 | 11.4% | 1,847 | 12.4% | 2,379 | 14.1% |
| Federal Skilled Worker | 390 | 2.4% | 716 | 4.8% | 489 | 2.9% |
| Other Federal Economic | 273 | 1.7% | 273 | 1.8% | 242 | 1.4% |
| Provincial Nominee1 | 12,189 | 75.1% | 10,262 | 68.9% | 9,958 | 59.2% |
| Refugee | 1,505 | 9.3% | 1,768 | 11.9% | 3,730 | 22.2% |
| Other2 | 30 | 0.2% | 34 | 0.2% | 23 | 0.1% |
| Total | 16,231 | 6.2%3 | 14,900 | 5.5%3 | 16,821 | 5.7%3 |
| Difference from previous year | -1,331 | -8.9% | +1,921 | +11.4% | ||
Table 4: Summary of Canada Permanent Residents by Immigration Category
| Immigration Category | 2014 | 2015 | 2016 | |||
|---|---|---|---|---|---|---|
| Sponsored Family | 67,647 | 26.0% | 65,484 | 24.1% | 78,005 | 26.3% |
| Federal Skilled Workers | 67,600 | 26.0% | 70,136 | 25.8% | 65,607 | 22.1% |
| Other Federal Economic | 47,628 | 18.3% | 44,535 | 16.4% | 46,178 | 15.6% |
| Provincial Nominee2 | 49,970 | 19.2% | 55,703 | 20.5% | 44,219 | 14.9% |
| Refugee | 24,070 | 9.2% | 32,113 | 11.8% | 58,913 | 19.9% |
| Other2 | 3,377 | 1.3% | 3,844 | 1.4% | 3,430 | 1.2% |
| Total | 260,292 | 100.0% | 271,815 | 100.0% | 296,352 | 100.0% |
| Difference from previous year | +11,523 | +4.4% | +24,537 | +9.0% | ||
Immigration by Province or Territory
In 2016, the top destinations for new permanent residents were Ontario, Quebec and Alberta, followed by British Columbia and Manitoba. Manitoba saw the fifth largest increase in immigration (12.9%) of all provinces after PEI (94.4%), New Brunswick (81.3%), Nova Scotia (61.1%), and Saskatchewan (18.7%).
Table 5: Summary of Canada Permanent Residents by Province/Territory
| Province/Territory | 2014 | 2015 | 2016 | |||
|---|---|---|---|---|---|---|
| Newfoundland and Labrador | 899 | 0.3% | 1,122 | 0.4% | 1,188 | 0.4% |
| Prince Edward Island | 1,632 | 0.6% | 1,190 | 0.4% | 2,313 | 0.8% |
| Nova Scotia | 2,669 | 1.0% | 3,403 | 1.3% | 5,483 | 1.9% |
| New Brunswick | 2,837 | 1.1% | 2,578 | 0.9% | 4,675 | 1.6% |
| Quebec | 50,245 | 19.3% | 48,961 | 18.0% | 53,237 | 18.0% |
| Ontario | 95,760 | 36.8% | 103,601 | 38.1% | 110,010 | 37.1% |
| Manitoba | 16,231 | 6.2% | 14,900 | 5.5% | 16,821 | 5.7% |
| Saskatchewan | 11,830 | 4.5% | 12,518 | 4.6% | 14,856 | 5.0% |
| Alberta | 42,497 | 16.3% | 47,199 | 17.4% | 49,196 | 16.6% |
| British Columbia | 35,172 | 13.5% | 35,732 | 13.1% | 38,069 | 12.8% |
| Northwest Territories | 167 | 0.1% | 211 | 0.1% | 185 | 0.1% |
| Nunavut | 23 | 0.0% | 37 | 0.0% | 36 | 0.0% |
| Yukon | 304 | 0.1% | 267 | 0.1% | 211 | 0.1% |
| Not stated | 26 | 0.0% | 96 | 0.0% | 72 | 0.0% |
| Total | 260,292 | 100.0% | 271,815 | 100.0% | 296,352 | 100.0% |
Immigration by City
In 2016, Winnipeg continued to rank 6th among Canadian cities as a destination for immigrants, as it did in 2014 and 2015 following Toronto, Montreal, Vancouver, Calgary, Edmonton. Together, these cities attracted about 70% of new permanent residents.
Table 6: Summary of Canada Permanent Residents by Census Metropolitan Area (CMA)
| CMA | 2014 | 2015 | 2016 | |||
|---|---|---|---|---|---|---|
| Toronto | 75,631 | 29.1% | 82,096 | 30.2% | 81,367 | 27.5% |
| Montréal | 40.317 | 15.5% | 39,484 | 14.5% | 41,645 | 14.1% |
| Vancouver | 28,404 | 10.9% | 28,383 | 10.4% | 29,716 | 10.0% |
| Calgary | 19,537 | 7.5% | 21,700 | 8.0% | 21,433 | 7.2% |
| Edmonton | 15,446 | 5.9% | 16,740 | 6.2% | 17,884 | 6.0% |
| Winnipeg | 13,859 | 5.3% | 12,391 | 4.6% | 14,068 | 4.7% |
| Ottawa – Gatineau | 5,265 | 2.0% | 6,248 | 2.3% | 7,867 | 2.7% |
| Saskatoon | 4,458 | 1.7% | 4,449 | 1.6% | 5,750 | 1.9% |
| Regina | 3,771 | 1.4% | 3,971 | 1.5% | 4,994 | 1.7% |
| Halifax | 2,079 | 0.8% | 2,735 | 1.0% | 4,568 | 1.5% |
| Hamilton | 3,099 | 1.2% | 3,021 | 1.1% | 4,191 | 1.4% |
| Total Top Ten | 209,787 | 80.6% | 218,483 | 80.4% | 225,101 | 76.0% |
| Other | 50,505 | 19.4% | 53,332 | 19.6% | 71,251 | 24.0% |
| Total | 260,292 | 100% | 271,518 | 100% | 296,352 | 100% |
3. Manitoba Permanent Residents
Between 2007 and 2016, more than 141,800 immigrants have settled in Manitoba. In 2016, landed immigrants accounted for 20.7% of Manitoba’s labour force, up from 14.5% in 2006.
The largest driver of economic growth in our province is the Manitoba Provincial Nominee Program (MPNP). On an annual basis, the MPNP nominates skilled workers and business investors who are best suited to contribute to our economy.
Between 2007 and 2016, the MPNP landings contributed to approximately 70% of all immigrants to Manitoba, and more than 90% of all economic immigrants to the province. In 2016, Manitoba’s Provincial Nominees accounted for 93.2% of all economic immigrants (9,958) while 6.8% arrived under other economic categories (731).
In the last decade, roughly 20% of Provincial Nominees settled outside of the Winnipeg census subdivision, compared to 12% of those from other immigrant classes.
Manitoba continues to establish partnerships with employers receive the largest share of Provincial Nominees across Canada, reaching 21.5% of the total Provincial Nominees to Canada in 2016. Manitoba continues to work with the federal government, employers, and communities to attract and retain immigrants. Manitoba Provincial Nominees have a retention rate of 88.59%, the fourth highest among Canadian provinces outside of Quebec.
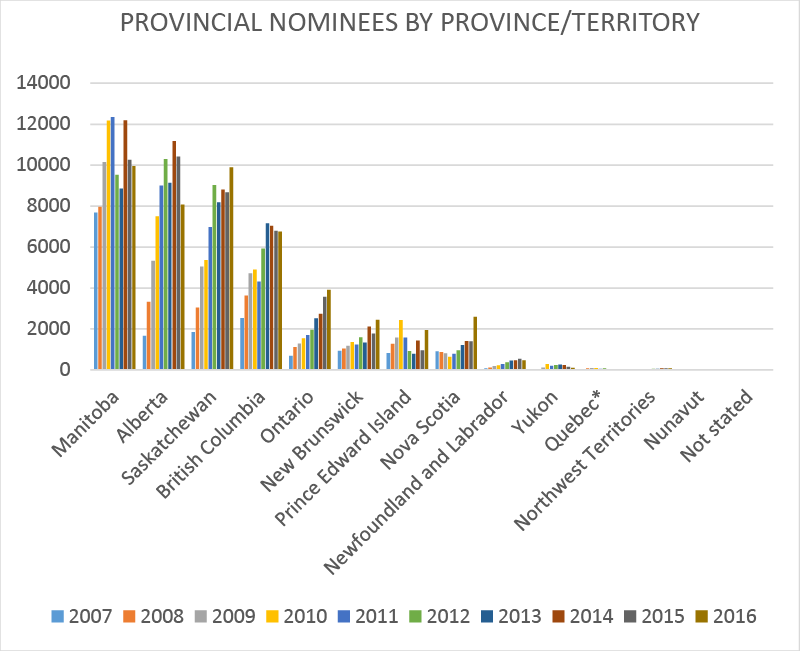
Table 7: Manitoba Permanent Residents by Immigration Category
| 2007 | 2008 | 2009 | 2010 | 2011 | 2012 | 2013 | 2014 | 2015 | 2016 | Total | |
|---|---|---|---|---|---|---|---|---|---|---|---|
| PNP Landings | 7,687 | 7,967 | 10,152 | 12,177 | 12,342 | 9,528 | 8,857 | 12,189 | 10,262 | 9,958 | 101,119 |
Table 8: Manitoba Permanent Residents by Immigration Category
| Immigration Category | 2014 | 2015 | 2016 | |||
|---|---|---|---|---|---|---|
| Sponsored Family | ||||||
| Principal Applicant | 1,522 | 9.4% | 1,478 | 9.9% | 1,963 | 11.7% |
| Spouse/Partner/Dependant | 322 | 2.0% | 369 | 2.5% | 416 | 2.5% |
| Sponsored Family Subtotal | 1,844 | 11.4% | 1,847 | 12.4% | 2,379 | 14.1% |
| Economic Class | ||||||
| Business4 | 21 | 0.1% | — | — | 11 | 0.1% |
| Canadian Experience Class – PA | 86 | 0.5% | 70 | 0.5% | 58 | 0.3% |
| Canadian Experience Class – SD | 64 | 0.4% | 46 | 0.3% | 58 | 0.3% |
| Caregiver Class – PA | 61 | 0.4% | 61 | 0.4% | 46 | 0.3% |
| Caregiver Class – SD | 41 | 0.3% | 85 | 0.6% | 50 | 0.3% |
| Provincial/Territorial Nominees – PA | 4,935 | 30.4% | 4,362 | 29.3% | 4,112 | 24.4% |
| Provincial/Territorial Nominees – SD | 7,254 | 44.7% | 5,900 | 39.6% | 5,846 | 34.8% |
| Skilled Trades | — | — | — | — | 19 | 0.1 |
| Skilled Workers – PA | 141 | 0.9% | 275 | 1.8% | 197 | 1.2% |
| Skilled Workers – SD | 249 | 1.5% | 441 | 3.0% | 292 | 1.7% |
| Economic Class Subtotal | 12,852 | 79.2% | 11,251 | 75.5% | 10,689 | 63.5% |
| Refugees | ||||||
| Government-Assisted Refugees | 436 | 2.7% | 694 | 4.7% | 1,271 | 7.6% |
| Privately Sponsored Refugees | 1,012 | 6.2% | 979 | 6.6% | 2,069 | 12.3% |
| Blended Sponsorship Refugees | 13 | 0.1% | 41 | 0.3% | 320 | 1.9% |
| Protected Persons in Canada & Dependents | 44 | 0.3% | 54 | 0.4% | 70 | 0.4% |
| Refugee Subtotal | 1,505 | 9.3% | 1,768 | 11.9% | 3,730 | 22.2% |
| Other Immigrants | 30 | 0.2% | 34 | 0.2% | 23 | 0.1% |
| Total | 16,231 | 100% | 14,900 | 100% | 16,821 | 100% |
Sponsored Family
To achieve family reunification, eligible Canadian citizens and permanent residents living in Canada can sponsor their family members. In 2016, Manitoba received 2,379 permanent residents who accounted for 14% of the Sponsored Family category. The top source countries accounting for 58.1% of this immigration category include India, Philippines, China and the United States.
Refugees
Manitobans continued welcoming refugees from all over the world into their communities and provided them with support. Of all permanent residents to Manitoba in 2016, 22.2% landed as refugees and protected persons (3,370), the highest number of refugees since 1990 and the highest number per capita in Canada. Manitoba resettled 6.3% of all refugees and protected persons to Canada including approximately 5.3% of Canada’s government-assisted refugees (1,271) and 11.1% of privately sponsored refugees (2,069). Thirty-four% of resettled refugees to Manitoba came under the National Syrian Refugee Resettlement Initiative. Eritrea, Somalia, Ethiopia and Democratic Republic of Congo were among the other top countries affected by conflict and war in 2016.
Resettled refugees include government-assisted refugees, privately sponsored refugees, and Blended Visa Office-Referred refugees.
Table 9: Resettled Refugees Admitted to Manitoba by Syrian/Non-Syrian Refugee
Refugees
| 2015 | 2016 | Total | |
|---|---|---|---|
| Non-Syrian Refugee | 1,483 | 2,427 | 3,910 |
| Syrian Refugee | 231 | 1,233 | 1,464 |
| Total | 1,714 | 3,660 | 5,374 |
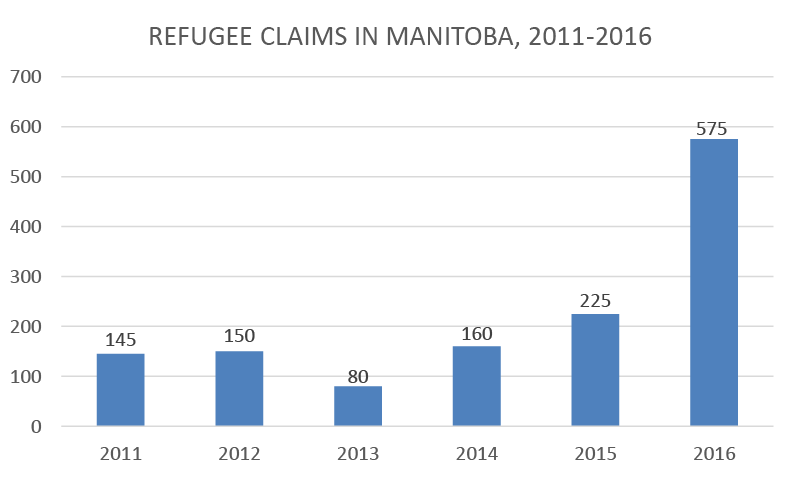
Table 10: Resettled Refugees Admitted to Manitoba by Country of Citizenship
| Country of Citizenship | 2015 | 2016 | Total |
|---|---|---|---|
| Eritrea | 632 | 1,355 | 1,987 |
| Syria* | 265 | 1,228 | 1,493 |
| Somalia, Democratic Republic of | 235 | 339 | 574 |
| Ethiopia | 113 | 217 | 330 |
| Congo, Democratic Republic of the | 127 | 212 | 339 |
| Afghanistan | 36 | 45 | 81 |
| Iraq | 74 | 42 | 116 |
| Sudan, Democratic Republic of | 31 | 37 | 68 |
| Myanmar (Burma) | 30 | 33 | 63 |
| Ivory Coast, Republic of | 8 | 20 | 28 |
| Other | 163 | 132 | 295 |
| Total | 1,714 | 3,660 | 5,374 |
4. Destination
Regional Destination (Economic Region)
Immigration continues to benefit regional communities. Between 2007-2016, approximately 114,190 immigrants have settled in the Winnipeg Economic Region, while more than 27,640 immigrants have settled in other economic regions outside of the Winnipeg. In 2016, 17% of newcomers chose to live outside of Winnipeg (2,807) and all economic regions of the province saw increases in immigration compared to the previous year with the exception of Southwest and Interlake.
Table 11: Manitoba Permanent Residents by Intended Destination
| Economic Region | 2014 | 2015 | 2016 | |||
|---|---|---|---|---|---|---|
| Winnipeg | 13,822 | 85.1% | 12,332 | 82.8% | 14,014 | 83.3% |
| Southwest | 1,074 | 6.6% | 1,272 | 8.5% | 1,078 | 6.4% |
| South Central | 464 | 2.9% | 456 | 3.1% | 705 | 4.2% |
| Southeast | 253 | 1.6% | 323 | 2.2% | 396 | 2.4% |
| North | 250 | 1.5% | 169 | 1.1% | 212 | 1.3% |
| Parklands | 135 | 0.8% | 96 | 0.6% | 170 | 1.0% |
| North Central | 112 | 0.7% | 122 | 0.8% | 128 | 0.8% |
| Interlake | 115 | 0.7% | 125 | 0.8% | 102 | 0.6% |
| Not Found | 8 | 0.0% | 5 | 0.0% | 16 | 0.1% |
| Total | 16,233 | 100% | 14,900 | 100% | 16,821 | 100% |
Community Destination (Census Metropolitan Area)
Since 2007, approximately more than 114,190 immigrants have settled in Winnipeg (Census Subdivision), compared to approximately 27,640 who have chosen more than 130 regional communities as their destination within Manitoba. During this period, approximately 7,500 immigrants settled in Brandon, 3,915 in Winkler, 2,850 in Steinbach, 2,000 in Neepawa, 1,480 in Morden, and 1,270 in Thompson. In 2016, more than 2,800 new permanent residents chose regional communities outside of Winnipeg, a 9% increase from 2015 (2,570). The top immigrant source countries to regional communities in 2016 were Philippines (750), India (380), Ukraine (200), Syria (170), and China (110).
Table 12: Manitoba Permanent Residents by Intended Destination (Top Ten)
| Census Subdivision | 2014 | 2015 | 2016 | ||||||
|---|---|---|---|---|---|---|---|---|---|
| Winnipeg | 13,822 | 85.1% | 1 | 12,330 | 82.8% | 1 | 14,014 | 83.3% | 1 |
| Brandon | 531 | 3.3% | 2 | 696 | 4.7% | 2 | 635 | 3.8% | 2 |
| Morden | 155 | 1.0% | 7 | 169 | 1.1% | 6 | 300 | 1.8% | 3 |
| Winkler | 218 | 1.3% | 4 | 192 | 1.3% | 4 | 255 | 1.5% | 4 |
| Neepawa | 422 | 2.6% | 3 | 453 | 3.0% | 3 | 253 | 1.5% | 5 |
| Steinbach | 158 | 1.0% | 6 | 190 | 1.3% | 5 | 215 | 1.3% | 6 |
| Thompson | 200 | 1.2% | 5 | 136 | 0.9% | 7 | 149 | 0.9% | 7 |
| Portage la Prairie | 60 | 0.4% | 9 | 95 | 0.6% | 8 | 103 | 0.6% | 8 |
| Altona | — | — | — | 50 | 0.3% | 9 | 51 | 0.3% | 9 |
| Dauphin | 39 | 0.2% | 10 | 32 | 0.2% | 10 | 50 | 0.3% | 10 |
| Russell | 72 | 0.4% | 8 | — | — | — | — | — | — |
| Total Top Ten | 15,677 | 96.6% | 14,343 | 96.3% | 16,025 | 95.3% | |||
| Other Municipalities | 556 | 3.4% | 557 | 3.7% | 796 | 4.7% | |||
| Total | 16,233 | 100% | 14,900 | 100% | 16,821 | 100% | |||
The total indicated is the sum of the top ten for each respective year.
5. Source Country
In 2016, Philippines, India, Eritrea, Syria and China ranked among the top five source countries for immigrants to Manitoba, representing 61.1% of all immigrants. Eritrea increased to third place, largely due to the private sponsorship of Eritrea refugees. On a national level, and with the exception of Syria, Philippines, India and China continue to rank as the top three source countries to Canada since 2014.
Table 13: Manitoba Permanent Residents by Country of Citizenship (Top Ten)
| Country of Citizenship | 2014 | 2015 | 2016 | ||||||
|---|---|---|---|---|---|---|---|---|---|
| Philippines | 4,921 | 30.3% | 1 | 3,826 | 25.7% | 1 | 3,604 | 21.4% | 1 |
| India | 3,625 | 22.3% | 2 | 3,071 | 20.6% | 2 | 3,001 | 17.8% | 2 |
| Eritrea | 572 | 3.5% | 5 | 664 | 4.5% | 3 | 1,413 | 8.4% | 3 |
| Syria | 287 | 1.9% | 10 | 1,242 | 7.4% | 4 | |||
| China, People’s Republic of | 1,007 | 6.2% | 3 | 646 | 4.3% | 4 | 1,030 | 6.1% | 5 |
| Israel | 427 | 2.6% | 6 | 473 | 3.2% | 6 | 631 | 3.8% | 6 |
| Nigeria | 663 | 4.1% | 4 | 609 | 4.1% | 5 | 523 | 3.1% | 7 |
| Ukraine | 277 | 1.7% | 9 | — | — | — | 464 | 2.8% | 8 |
| Pakistan | — | — | — | 459 | 3.1% | 7 | 400 | 2.4% | 9 |
| Somalia, Democratic Republic of | 363 | 2.2% | 8 | — | — | — | 365 | 2.2% | 10 |
| Ethiopia | — | — | — | 295 | 2.0% | 9 | — | — | — |
| Russia | 260 | 1.6% | 10 | 327 | 2.2% | 8 | — | — | — |
| Korea, Republic of | 426 | 2.6% | 7 | — | — | — | — | — | — |
| Total Top Ten | 12,541 | 77.3% | 10,657 | 71.5% | 12,673 | 75.3% | |||
| Other Countries | 3,690 | 22.7% | 4,243 | 28.5% | 4,148 | 24.7% | |||
| Total | 16,231 | 100% | 14,900 | 100% | 16,821 | 100% | |||
The total indicated is the sum of the top ten for each respective year.
In 2016, 52.4% of Manitoba’s new permanent residents arrived from Asia and Pacific regions, followed by Africa and the Middle East (32.7%), Europe (10%), South and Central America (3.6%) and the United States (1.1%).

Table 14: Manitoba Permanent Residents by World Region, 2014 to 2016
| World Region | 2014 | 2015 | 2016 |
|---|---|---|---|
| Asia & Pacific | 10,861 | 9,013 | 8,823 |
| Africa & Middle East | 3,203 | 3,677 | 5,495 |
| Europe | 1,285 | 1,410 | 1,680 |
| Americas | 601 | 591 | 605 |
| United States of America | 253 | 190 | 190 |
| Stateless & Not Stated5 | 28 | 19 | 28 |
| Total | 16,231 | 14,900 | 16,821 |
6. Demographics
Age-Gender Structure
Newcomers are important contributors to Manitoba’s population growth and to the rejuvenation of the labour force. In 2016, the immigrant media age was 28 years while the media age of Manitobans was 38 years. Male and females numbers were roughly equal.
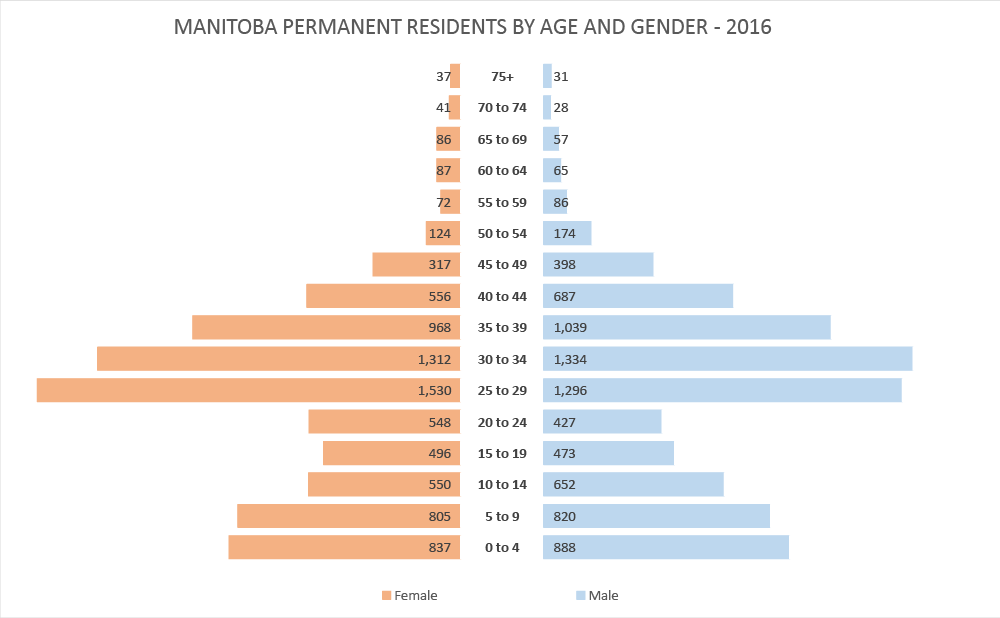
Table 15: Manitoba Permanent Residents by Age and Gender
| 2014 | 2015 | 2016 | ||||||||||
|---|---|---|---|---|---|---|---|---|---|---|---|---|
| Male | Female | Male | Female | Male | Female | |||||||
| 0 to 4 years old | 767 | 4.7% | 693 | 4.3% | 678 | 4.6% | 666 | 4.5% | 888 | 5.3% | 837 | 5.0% |
| 5 to 9 years old | 734 | 4.5% | 692 | 4.3% | 718 | 4.8% | 637 | 4.3% | 820 | 4.9% | 805 | 4.8% |
| 10 to 14 years old | 710 | 4.4% | 611 | 3.8% | 605 | 4.1% | 477 | 3.2% | 652 | 3.9% | 550 | 3.3% |
| 15 to 19 years old | 491 | 3.0% | 425 | 2.6% | 389 | 2.6% | 425 | 2.9% | 473 | 2.8% | 496 | 2.9% |
| 20 to 24 years old | 467 | 2.9% | 566 | 3.5% | 473 | 3.2% | 522 | 3.5% | 427 | 2.5% | 548 | 3.3% |
| 25 to 29 years old | 1,268 | 7.8% | 1,440 | 8.9% | 1,330 | 8.9% | 1,421 | 9.5% | 1,296 | 7.7% | 1,530 | 9.1% |
| 30 to 34 years old | 1,220 | 7.5% | 1,247 | 7.7% | 1,220 | 8.2% | 1,204 | 8.1% | 1,334 | 7.9% | 1,312 | 7.8% |
| 35 to 39 years old | 958 | 5.9% | 920 | 5.7% | 877 | 5.9% | 798 | 5.4% | 1,039 | 6.2% | 968 | 5.8% |
| 40 to 44 years old | 690 | 4.3% | 636 | 3.9% | 594 | 4.0% | 513 | 3.4% | 687 | 4.1% | 556 | 3.3% |
| 45 to 49 years old | 435 | 2.7% | 361 | 2.2% | 342 | 2.3% | 272 | 1.8% | 398 | 2.4% | 317 | 1.9% |
| 50 to 54 years old | 240 | 1.5% | 172 | 1.1% | 171 | 1.1% | 107 | 0.7% | 174 | 1.0% | 124 | 0.7% |
| 55 to 59 years old | 83 | 0.5% | 87 | 0.5% | 77 | 0.5% | 78 | 0.5% | 86 | 0.5% | 72 | 0.4% |
| 60 to 64 years old | 62 | 0.4% | 58 | 0.4% | 61 | 0.4% | 58 | 0.4% | 65 | 0.4% | 87 | 0.5% |
| 65 to 69 years old | 36 | 0.2% | 53 | 0.3% | 35 | 0.2% | 50 | 0.3% | 57 | 0.3% | 86 | 0.5% |
| 70 to 74 years old | 27 | 0.2% | 29 | 0.2% | 20 | 0.1% | 36 | 0.2% | 28 | 0.2% | 41 | 0.2% |
| 75+ | 27 | 0.2% | 22 | 0.1% | 21 | 0.1% | 20 | 0.1% | 31 | 0.2% | 37 | 0.2% |
| Age not stated | 3 | 0.0% | 1 | 0.0% | ||||||||
| Subtotal | 8,218 | 50.6% | 8,013 | 49.4% | 7,611 | 51.1% | 7,284 | 48.9% | 8,455 | 50.3% | 8,366 | 49.7% |
| Gender not stated | 5 | |||||||||||
| Total | 16,231 | 14,900 | 16,821 | |||||||||
7. Official Languages
Table 16: Manitoba Permanent Residents by Mother Tongue (Top Ten)
| Mother Tongue | 2014 | 2015 | 2016 | ||||||
|---|---|---|---|---|---|---|---|---|---|
| Tagalog | 4,264 | 26.3% | 1 | 3,196 | 21.4% | 1 | 3,062 | 18.2% | 1 |
| Punjabi | 2,612 | 16.1% | 2 | 1,922 | 12.9% | 2 | 2,061 | 12.3% | 2 |
| Tigrinya | 452 | 2.8% | 7 | 451 | 3.0% | 8 | 1,106 | 6.6% | 3 |
| Arabic | — | — | — | 483 | 3.2% | 7 | 1,103 | 6.6% | 4 |
| Russian | 842 | 5.2% | 3 | 898 | 6.0% | 3 | 1,064 | 6.3% | 5 |
| English | 840 | 5.2% | 4 | 712 | 4.8% | 4 | 744 | 4.4% | 6 |
| Chinese | 784 | 4.8% | 5 | 515 | 3.5% | 6 | 738 | 4.4% | 7 |
| Gujarati | 473 | 2.9% | 6 | 585 | 3.9% | 5 | 514 | 3.1% | 8 |
| Somali | — | — | — | — | — | — | 380 | 2.3% | 9 |
| Urdu | — | — | — | 412 | 2.8% | 10 | 352 | 2.1% | 10 |
| Korean | 425 | 2.6% | 8 | — | — | — | — | — | — |
| Yoruba | 372 | 2.3% | 9 | — | — | — | — | — | — |
| Spanish | 371 | 2.3% | 10 | 414 | 2.8% | 9 | — | — | — |
| Total Top Ten | 11,435 | 70.5% | 9,588 | 64.3% | 11,124 | 66.1% | |||
| Other Languages | 4,796 | 29.5% | 5,312 | 35.7% | 5,697 | 33.9% | |||
| Total | 16,231 | 100% | 16,900 | 100% | 16,821 | 100% | |||
Official Language Spoken
In 2016, the percentage of Manitoba’s immigrants who identified English as an official language spoken continued increasing to 67.0% from 63.7% in 2010.
In 2016, Manitoba welcomed 345 immigrants who identified French as their official language spoken, representing 2% of all immigrants to Manitoba. From 2007 to 2016, nearly 4,000 immigrants have arrived in Manitoba with the ability to speak French.
Manitoba supports the Manitoba francophone community’s goal of increasing francophone immigration. In 2016, 4.2% of all MPNP nominations were francophone and approximately 70% of all French-speaking immigrants came through the MPNP. The top source countries for all immigrants who identified French, as well as both French and English, as their official language spoken were France, Philippines, Democratic Republic of Congo (DRC), Cameroon, Morocco and Ivory Coast.
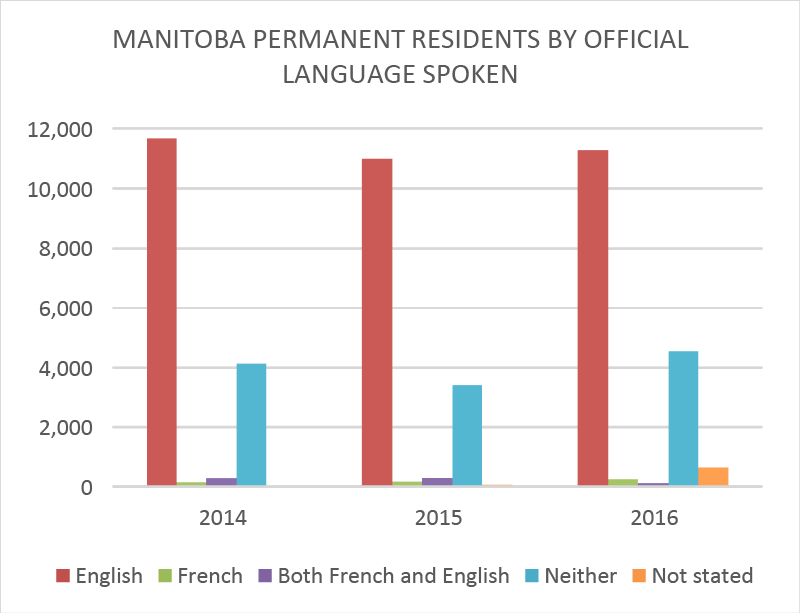
Table 17: Manitoba Permanent Residents by Official Language Spoken
| Official Language | 2014 | 2015 | 2016 |
|---|---|---|---|
| English | 11,683 | 11,005 | 11,281 |
| French | 137 | 157 | 235 |
| Both French and English | 270 | 272 | 110 |
| Neither | 4,141 | 3,409 | 4,554 |
| Not stated | — | 57 | 641 |
| Total | 16,231 | 14,900 | 16,821 |
8. Education, Occupation, and Skill Level
To ensure that immigrants can contribute their skills and experience to Manitoba’s economy, the Province is renewing the MPNP to strengthen partnerships with industry and post-secondary institutions. In addition, the Province continues to invest in successful employment programs like Manitoba start which also provides guidance to professionals needing to have their international qualifications recognized.
Table 18: Manitoba Permanent Residents by Level of Education (Aged 25 Years and Over)
| Level of Education | 2014 | 2015 | 2016 | |||
|---|---|---|---|---|---|---|
| Secondary or Less6 | 2,478 | 24.6% | 2,075 | 22.3% | 2,218 | 21.5% |
| Formal Trade Cert. or Apprenticeship | 626 | 6.2% | 565 | 6.1% | 640 | 6.2% |
| Non-University Certificate or Diploma | 803 | 8.0% | 664 | 7.1% | 671 | 6.5% |
| Some University – No Degree | 509 | 5.1% | 535 | 5.7% | 552 | 5.3% |
| Bachelor’s Degree | 4,044 | 40.1% | 3,832 | 41.2% | 3,942 | 38.2% |
| Some Post-Grad. Education – No Degree | 229 | 2.3% | 257 | 2.8% | 222 | 2.2% |
| Master’s Degree | 1,266 | 12.6% | 1,226 | 13.2% | 1,312 | 12.7% |
| Doctorate | 120 | 1.2% | 115 | 1.2% | 87 | 0.8% |
| Not stated | — | — | 37 | 0.4% | 681 | 6.6% |
| Total | 10,075 | 100% | 9,306 | 100% | 10,325 | 100% |
Occupation
The Manitoba Provincial Nominee Program selects people whose participation enhances Manitoba’s economic development with specialized skills needed in the changing labour market. Registered nurses, general office support workers, cooks, transport truck drivers and food counter attendants were among the top occupations of economic immigrants to Manitoba in 2016.
Table 19: Manitoba Economic Permanent Residents by Occupation and Principal Applicants Only (Top Ten)
| Occupation | 2014 | 2015 | 2016 | ||||||
|---|---|---|---|---|---|---|---|---|---|
| 3012 – Registered nurses and registered psychiatric nurses | 385 | 7.4% | 1 | 265 | 5.6% | 1 | 168 | 3.8% | 1 |
| 1411 – General office support workers | 130 | 2.5% | 4 | 124 | 2.6% | 3 | 121 | 2.7% | 2 |
| 6322 – Cooks | 129 | 2.5% | 5 | 103 | 2.2% | 5 | 110 | 2.5% | 3 |
| 7511 – Transport truck drivers | — | — | — | 95 | 2.0% | 7 | 110 | 2.5% | 3 |
| 6711 – Food counter attendants, kitchen helpers and related support occupations | — | — | — | 110 | 2.3% | 4 | 107 | 2.4% | 4 |
| 9462 – Industrial butchers and meat cutters, poultry preparers and related workers | 151 | 2.9% | 3 | 213 | 4.5% | 2 | 103 | 2.3% | 5 |
| 1111 – Financial auditors and accountants | 103 | 2.0% | 6 | 94 | 2.0% | 8 | 103 | 2.3% | 5 |
| 0621 – Retail and wholesale trade managers | 94 | 1.8% | 8 | 96 | 2.0% | 6 | 99 | 2.2% | 6 |
| 6552 – Other customer and information services representatives | — | — | — | — | — | — | 88 | 2.0% | 7 |
| 0124 – Advertising, marketing and public relations managers | 84 | 1.6% | — | 82 | 1.7% | 9 | 87 | 2.0% | 8 |
| 1431 – Accounting and related clerks | 90 | 1.7% | 9 | — | — | — | 77 | 1.7% | 9 |
| 6421 – Retail salespersons | — | — | — | 95 | 2.0% | 7 | 64 | 1.4% | 10 |
| 1221 – Administrative officers | 87 | 1.7% | 10 | — | — | — | — | — | — |
| 4021 – College and other vocational instructors | 95 | 1.8% | 7 | — | — | — | — | — | — |
| 4031 – Secondary school teachers | 196 | 3.7% | 2 | 78 | 1.6% | 10 | — | — | — |
| 4032 – Elementary school and kindergarten teachers | 87 | 1.7% | 10 | — | — | — | — | — | — |
| 2174 – Computer programmers and interactive media developers | — | — | — | 78 | 1.6% | 10 | — | — | — |
| Total Top Ten | 1,631 | 31.2% | 1,433 | 30.0% | 1,237 | 27.9% | |||
| Other Occupations | 3,598 | 68.8% | 3,340 | 70.0% | 3,190 | 72.1% | |||
| Total | 5,229 | 100% | 4,773 | 100% | 4,427 | 100% | |||
Skill Type Category
Based on the National Occupation Classification System, in 2016, 71.0% of principal applicants under the economic category were considered highly skilled (NOC 0, A and B) and had previous occupations in:
- Sales and service
- Business, finance and administration
- Natural and applied sciences and related occupations
- Trades, Transport and Equipment Operators and Related Occupations
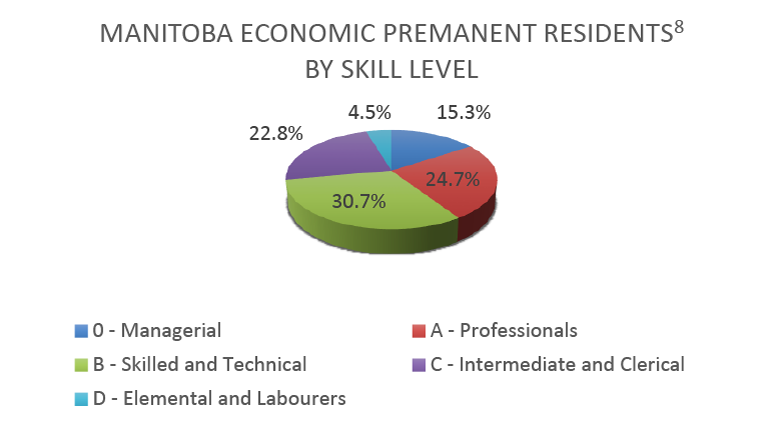
Table 20: Manitoba Economic Permanent Residents8 by Skill Type Category
| Principal Applicants Only | 2014 | 2015 | 2016 | |||
|---|---|---|---|---|---|---|
| 0 – Management Occupations | 517 | 9.9% | 517 | 10.8% | 545 | 12.3% |
| 1 – Business, Finance and Administrative Occupations | 788 | 15.1% | 721 | 15.1% | 756 | 17.1% |
| 2 – Natural and Applied Sciences and Related Occupations | 687 | 13.1% | 658 | 13.8% | 630 | 14.2% |
| 3 – Health Occupations | 692 | 13.2% | 570 | 11.9% | 401 | 9.1% |
| 4 – Occupations in Social Science, Education, Government Service and Religion | 627 | 12.0% | 432 | 9.1% | 321 | 7.3% |
| 5 – Occupations in Art, Culture, Recreation and Sport | 58 | 1.1% | 60 | 1.3% | 44 | 1.0% |
| 6 – Sales and Service Occupations | 806 | 15.4% | 816 | 17.1% | 771 | 17.4% |
| 7 – Trades, Transport and Equipment Operators and Related Occupations | 437 | 8.4% | 402 | 8.4% | 446 | 10.1% |
| 8 – Occupations Unique to Primary Industry | 28 | 0.5% | 42 | 0.9% | 81 | 1.8% |
| 9 – Occupations Unique to Processing, Manufacturing and Utilities | 264 | 5.0% | 338 | 7.1% | 212 | 4.8% |
| Other9 | 325 | 6.2% | 217 | 4.5% | 220 | 5.0% |
| Total | 5,229 | 100% | 4,773 | 100% | 4,427 | 100% |
9. Temporary Workers and International Students
In Manitoba, temporary residents who have worked for more than six months, or have graduated from a post-secondary program in the province, have the opportunity to apply to the MPNP and become permanent residents. In 2016, Manitoba received 6,413 temporary workers through the federal International Mobility Program and 856 through the Temporary Foreign Worker Program (with a Labour Market Impact Assessment). Since 2005, 8,482 temporary foreign workers have been nominated for permanent residence through the Manitoba Provincial Nominee Program. In 2016, Manitoba approved 1,491 employer registration certificates to support employers to recruit or retain 3,740 positions.
Table 21: Manitoba Work Permit Holders by Program and Year in which Permit(s) Became Effective10
| 2007 | 2008 | 2009 | 2010 | 2011 | 2012 | 2013 | 2014 | 2015 | 2016 | |
|---|---|---|---|---|---|---|---|---|---|---|
| Temporary Foreign Worker Program Work Permit Holders | 2,275 | 2,288 | 1,696 | 1,309 | 1,145 | 1,581 | 1,496 | 1,111 | 836 | 856 |
| International Mobility Program Work Permit Holders | 2,775 | 3,311 | 3,339 | 3,638 | 3,732 | 3,945 | 4,519 | 4,827 | 4,849 | 6,413 |
Table 22: Manitoba Temporary Foreign Worker (TFW) Program Work Permit Holders by Intended Destination11 and Year in which Permit(s) Became Effective10
| Census Metropolitan Area | 2007 | 2008 | 2009 | 2010 | 2011 | 2012 | 2013 | 2014 | 2015 | 2016 |
|---|---|---|---|---|---|---|---|---|---|---|
| Brandon | 420 | 501 | 3,339 | 3,638 | 3,732 | 3,945 | 4,519 | 4,827 | 4,849 | 6,413 |
| Winnipeg | 1,358 | 1,338 | 984 | 847 | 789 | 868 | 907 | 576 | 243 | 257 |
| Other | 506 | 452 | 462 | 364 | 298 | 532 | 484 | 482 | 419 | 462 |
| Total Unique12 TFW Work Permit Holders | 2,275 | 2,288 | 1,696 | 1,309 | 1,145 | 1,581 | 1,496 | 1,111 | 836 | 856 |
Table 23: Manitoba International Mobility Program (IMP) Work Permit Holders by Intended Destination11 and Year in which Permit(s) Became Effective10
| Census Metropolitan Area | 2007 | 2008 | 2009 | 2010 | 2011 | 2012 | 2013 | 2014 | 2015 | 2016 |
|---|---|---|---|---|---|---|---|---|---|---|
| Brandon | 246 | 363 | 366 | 368 | 225 | 154 | 176 | 252 | 186 | 173 |
| Winnipeg | 2,014 | 2,335 | 2,369 | 2,561 | 2,739 | 2,909 | 3,219 | 3,120 | 3,293 | 4,711 |
| Other | 523 | 624 | 611 | 715 | 771 | 889 | 1,163 | 1,508 | 1,393 | 1,561 |
| Total Unique12 IMP Work Permit Holders | 2,775 | 3,311 | 3,339 | 3,638 | 3,732 | 3,945 | 4,519 | 4,827 | 4,849 | 6,413 |
International Students
In 2016, the number of foreign students entries to Manitoba was 8,652. Most international students (93%) enrolled in educational institutions in Winnipeg. The top source countries to Manitoba were China (27.9%), India (13.2%), Nigeria (9.6%) and Brazil (4.4%).
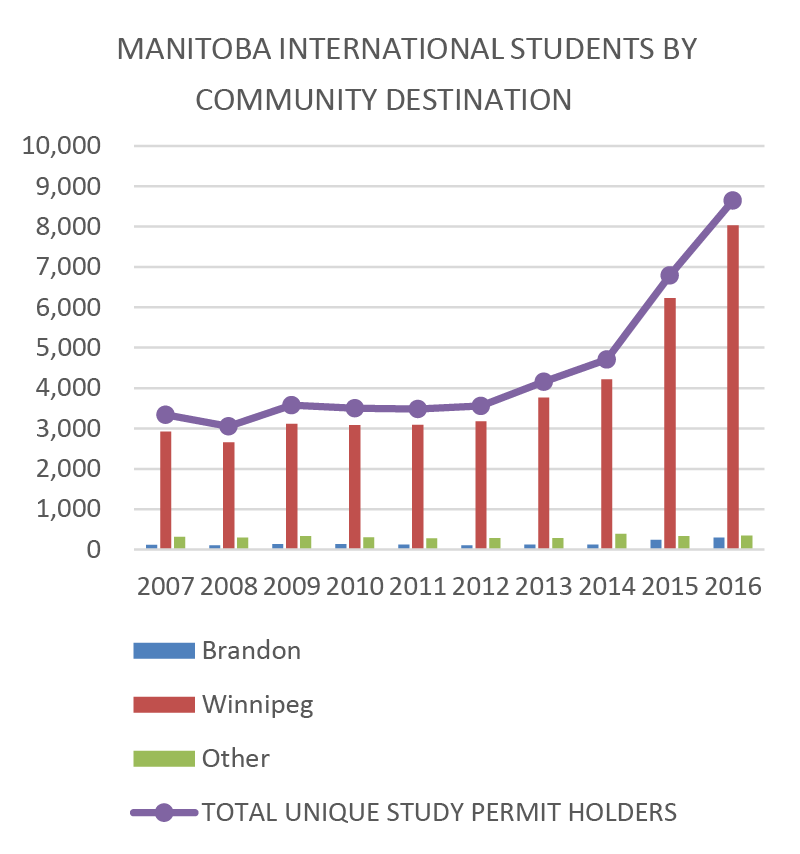
Table 24: Manitoba International Student Study Work Permit Holders by Intended Destination12 and Year in which Permit(s) Became Effective
| Census Metropolitan Area | 2007 | 2008 | 2009 | 2010 | 2011 | 2012 | 2013 | 2014 | 2015 | 2016 |
|---|---|---|---|---|---|---|---|---|---|---|
| Brandon | 113 | 105 | 133 | 131 | 125 | 101 | 121 | 121 | 234 | 293 |
| Winnipeg | 2,919 | 2,656 | 3,108 | 3,079 | 3,088 | 3,178 | 3,767 | 4,217 | 6,236 | 8,027 |
| Other | 307 | 293 | 335 | 301 | 269 | 283 | 279 | 385 | 329 | 343 |
| Total Unique Study Permit Holders | 3,334 | 3,051 | 3,572 | 3,504 | 3,477 | 3,557 | 4,161 | 4,712 | 6,793 | 8,652 |
Table 25: Manitoba International Student Study Work Permit Holders by Country of Citizenship and Year in which Permit Became Effective
| Country of Citizenship | 2014 | 2015 | 2016 | ||||||
|---|---|---|---|---|---|---|---|---|---|
| China, People’s Republic of | 1,130 | 24.0% | 1 | 1,907 | 28.1% | 1 | 2,416 | 27.9% | 1 |
| India | 428 | 9.0% | 3 | 696 | 10.2% | 3 | 1,143 | 13.2% | 2 |
| Nigeria | 599 | 12.7% | 2 | 794 | 11.7% | 2 | 833 | 9.6% | 3 |
| Brazil | 272 | 5.8% | 4 | 351 | 5.2% | 4 | 385 | 4.4% | 4 |
| Korea, Republic of | 267 | 5.7% | 5 | 333 | 4.9% | 6 | 356 | 4.1% | 5 |
| Pakistan | 249 | 5.3% | 6 | 335 | 4.9% | 5 | 345 | 4.0% | 6 |
| Vietnam, Socialist Republic of | — | — | — | 122 | 1.8% | 9 | 290 | 3.4% | 7 |
| Bangladesh | 83 | 1.8% | 10 | 157 | 2.3% | 7 | 253 | 2.9% | 8 |
| Japan | — | — | — | — | — | — | 166 | 1.9% | 9 |
| Kenya | — | — | — | — | — | — | 155 | 1.8% | 10 |
| United States of America | 156 | 3.3% | 7 | 151 | 2.2% | 8 | — | — | — |
| Mexico | 92 | 2.0% | 9 | 106 | 1.6% | 10 | — | — | — |
| Iran | 97 | 2.1% | 8 | — | — | — | — | — | — |
| Total Top Ten | 3,370 | 71.5% | 4,952 | 72.9% | 6,342 | 73.3% | |||
| Other Countries of Citizenship | 1,342 | 28.5% | 1,841 | 27.1% | 2,310 | 26.7% | |||
| Total | 4,712 | 100% | 6,793 | 100% | 8,652 | 100% | |||
Footnotes
1 Provincial Nominees are a subcategory of the Federal Economic Class.
2 Includes Humanitarian and Compassionate, Permit Holders Class, Public Policy, and Family Relations.
3 Manitoba’s share of Canada’s immigration.
4 Includes entrepreneur, investor and self-employed.
5 Stateless & Not Stated also includes world region data which, due to privacy considerations, has been supressed.
6 Including no education level – Due to operational adjustments to IRCCs administrative data files, data under the variable “Level of Education” are preliminary estimates and are currently under review.
7 Includes Provincial Nominees, federally selected skilled workers, business persons, live-in caregivers, and Canadian experience class.
8 This table represents skill level for Economic Immigrant Principal Applicants only, including Provincial Nominees, federally selected skilled workers, business persons, live-in caregivers, and Canadian experience class.
9 Other category includes those intending to work including New Workers (15 years of age or older). Not intending to work includes Other Non-Workers (15 years of age or older) and Students (15 years of age or older). Those ‘not stated’ are also included.
10 This term refers to permit holders with a valid permit that was also signed in the given year.
11 Defined by the intended destination as specified on the permit and when the intended destination is not specified for permits signed on or after January 1, 2012, the last known address of the permit holder as of December 31st of the given year is used instead.
12 The total unique count may not equal to the sum of permit holders in each program as an individual may hold more than one type of permit over a given period.